# tlohde

Shifting Equilibriums

A topographical map showing the Rembesdalskåka outlet glacier of Hardangerjøkulen ice cap in Norway. Elevation is depicted by gray contours and a colour ramp from dark blue (low) to white (high). Within Hardangerjøkulen, a dashed line denotes the extent of Rembesdalskåka. Across which are several black lines, each one with a year label (from lowest elevation to highest: 1989, 1993, 2000, 1973, 2017, 1991, 1985, 2019, 1966). Around the edge of the ice cap several mountain peaks are labelled. A scale bar in the top right indicates that the whole map is ~20 km across. Several lakes are shown in a dark blue. The title / legend in the bottom left reads: 'Rembesdalskåka Equilibrium Line'. Credits along the bottom read: 'by:tlohde / Copernicus Global DEM (ESA) / Raup et al., (2007) The GLIMS Geospatial Glacier Database / Fluctuations of Glaciers Database, World Glacier Monitoring Service / OpenStreetMap contributors'
Shifting Equilibriums: Equilibrium lines at Rembesdalskåka, an outlet glacier of the Hardangerjøkulen ice cap, Norway. The equilibrium line marks the boundary on a glacier between the accumulation and ablation zones. The line moves up and down from year to year with changes in climate, snowfall and melt. In a warming climate, it is expected that the ELA (equilibrium line altitude) will rise as more of the glacier area is subject to net mass loss. Note: since the mid-90s Rembesdalskåka, like much of Hardangerjøkulen has thinned at ~0.8m/yr. This map does not account for this. Contours at the older ELAs are plotted on a modern DEM, as such the position of the ELAs shown are not strictly where they were, rather just at the elevation they were. This was made for day 27, Boundaries, of the 2025 #30DayMapChallenge.

projection UTM Zone 32N
tools Python libraries: geopandas, cartopy and matplotlib
data 
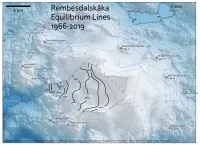
ELAs: WGMS (2025): Fluctuations of Glaciers (FoG) Database. World Glacier Monitoring Service (WGMS); Zurich; Switzerland. https://doi.org/10.5904/wgms-fog-2025-02b; Outline of Rembesdalskaaka: The GLIMS Geospatial Glacier Database (Raup et al., doi:10.1016/j.gloplacha.2006.07.018); Elevation: Copernicus Global DEM (30 m); Lakes & peaks: OpenStreetMap
font Junction by Caroline Hadilaksono & Tyler Finck
comments Rushed the final title placement (and the Finse label), which detract from something I'm otherwise quite pleased with. Also missing are the other outlet glacier labels. Tried plotting all ELAs from the WGMS dataset, but it could too crowded to label, and colour them in by year meant introducing an additional colorscale - thought about ditchingthe blues for the hypsometric tint in favour of gray, to then use the blues on ELAs over time. An inset timeseries would be useful too
date 27/11/2025