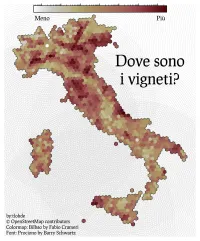
# tlohde

I Vigneti

A hexbin map showing density of vineyards across Italy. Map is titled 'Dove sono i vigneti?' The color scale goes from white through warm orange to dark red, with tick marks indicating that it is on a log scale. It is labelled Meno (less) and Piu (more). Credits in the bottom left read: 'by:tlohde / © OpenStreetMap contributors / Colormap: Bilbao by Fabio Crameri / Font: Prociono by Barry Schwartz'.
I Vigneti: Where are the vinyards? A hexbin choropleth showing the amount of land vineyards occupy across Italy. Colour scale is logarithmic. Made for day 25 of the 2025 #30DayMapChallenge: Hexagons

projection UTM Zone 33N
tools Python libraries: osmnx for getting the vinyards; h3py for making the hexbins; geopandas for wrangling; matplotlib for plotting
data © OpenStreetMap contributors
font Prociono by Barry Schwartz and the League of Moveable Type
comments At some point I will stop using logarithmic colour maps. With more time I would have labelled some of the more productive wine regions. Happy with the texture the overlapping buffers gave to the sea
date 25/11/2025