# tlohde

Figure 3

Three subplots, the two on the left cover the same extent, and the one on the right shows a smaller area contained within. The top left shows change in ice veloicty (green=faster, pink=slower). There is no pink, and the intensity of green increases towards the glacier. In the lower left the rate of surface elevation change is shown where red=thinning, blue=thickening; much of the glacier has thinned with the greatest thinning near the terminus. Two water bodies indicate some increases in elevation, however dh/dt values over water are not to be trusted. On the right, a close up satellite image of a glacier terminus with multiple terminus traces shown for a 6 year 2014-2020 period. Some terminus retreat is visible at the northern end of the glacier, near some grounded icebergs
Figure 3: Isortuarsuup Sermia: (a) change in average annual velocity between 2013–2021; (b) rate of surface elevation change (September 2012– June 2021) from ArcticDEM (negative denotes thinning); manually digitised ice margin shown in black in (a) and (b); (c) terminus positions 2014–2021. Red box in (a) denotes extent of (c). White arrows in (c) indicates the Little Ice Age trim-line and the black arrow points to the associated terminal moraine with icebergs grounded on its sublacustrine extension indicated by the orange arrow.

projection NSIDC Sea Ice Polar Stereographic North. EPSG:3413
tools Python libraries: geopandas, cartopy, xarray and matplotlib
data 
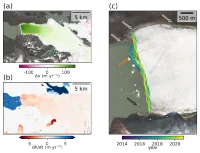
Ice Velocity data generated using auto-RIFT (Gardner et al., 2018) and provided by the NASA MEaSUREs ITS_LIVE; Surface elevation derived from Arctic DEM v4.1 (Porter et al., 2023); Background: Sentinel-2 acquisition from 19 September 2022 (ESA Copernicus, 2022)
comments A clear thinning and acceleration signal is displayed, and the terminus retreating from the hypothesised sublacustrine moraine is reasonably clear.
date 01/01/2024