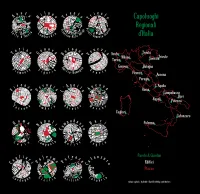
| projection |
UTM Zone 33N
|
| tools |
python: geopandas, matplotlib, osmnx, cartopy.
|
| data |
OpenStreetMap contributors.
|
| font |
Scoglietto by Petra Heidron
|
| comments |
It took me far too long to work out the required OSM tags for regional capital city nodes (tags={'capital':['4','yes']}, in case you were wondering). My custom matpotlib function for putting text along a curved path means the kerning looks a bit off on some of the region names, and the right edge of the region names appears to be curving away from the circle above. A scalebar somewhere would be useful (radius of ~300 m).
|
| date |
03/11/2024
|