| projection |
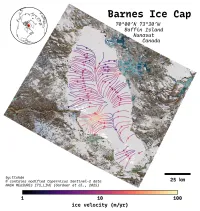
North Polar Stereo: central longitude: 45W, true scale latitude: 70N
|
| tools |
Python: matplotlib, stackstac, planetarycomputer, xarray, rioxarray & cartopy
|
| data |
Background image from Sentinel-2; Ice Velocity data generated using auto-RIFT (Gardner et al., 2018) and provided by the NASA MEaSUREs ITS_LIVE project (Gardner et al., 2025).
|
| font |
Recursive Sans & Mono, by Stephen Nixon, with Lisa Huang, Katja Schimmel. Rafał Buchner & Ben Kiel
|
| comments |
My crude cloud-free composite code (take the median over a stack of images that you know already have low cloud cover) was playing up a bit; and my old laptop struggling with the size of this image. I'm somewhat surprised that ice velocities aren't higher towards the lake towards the top right of this frame (where's north ed?). Charming little inset, though.
|
| date |
02/11/2025
|